In previous post I showed you how to configure MLC IO Accelerator from HP (it is basically Fusion IO product branded by HP). Today I will show you how can we use it with VMware vFlash Read Cache.
Benefits of using vFlash Read Cache
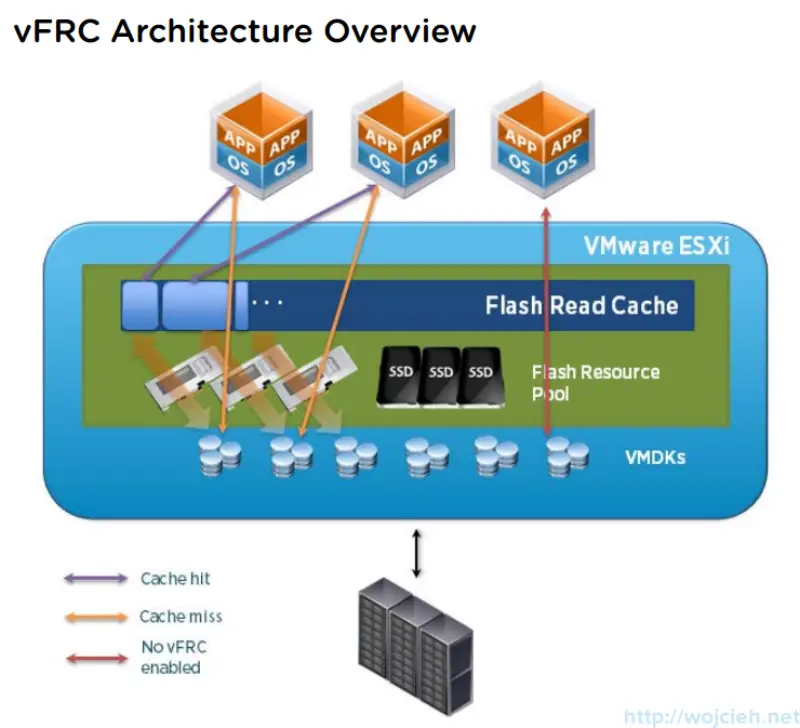
Virtual Flash allows you to accelerate virtual machine performance through the use of local SSD disks, which serve flash memory cache to chosen virtual machines running on the ESXi host. Virtual Flash Read Cache can supply low latency for extreme latency sensitive applications, thus enabling the virtualization of some computer systems/applications previously considered too I/O intensive and, therefore, impossible/implausible.
In this picture you can see architecture overview.
vFlash Read Cache configuration
Whole configuration is done using vSphere Web Client.
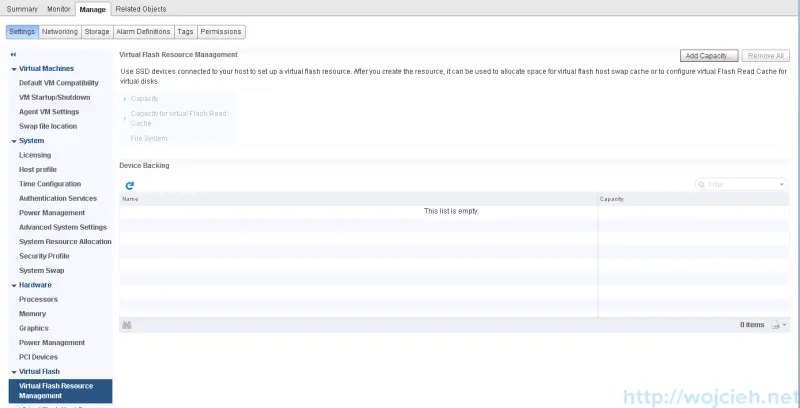
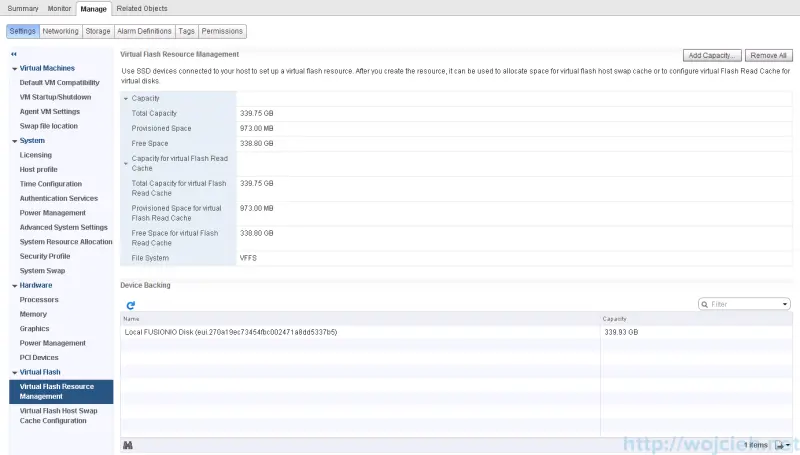
- Navigate to host and click Manage then Settings and Virtual Flash Resource Management and click Add Capacity.
- Select your local SSD device - in my case Fusion IO / HP MLC IO Accelerator and click ok.
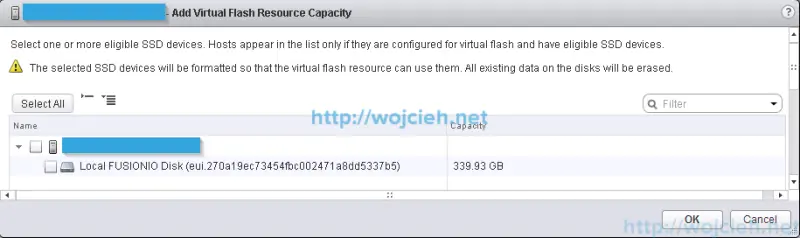
- Once you click Ok you will see it available for virtual Flash Read Cache.
Enable vFlash Read Cache on Virtual Machine
Virtual Flash Read Cache can be configured only using vSphere Web Client. Before you can do it you have to move virtual machine to host which is configured for virtual Flash Read Cache.
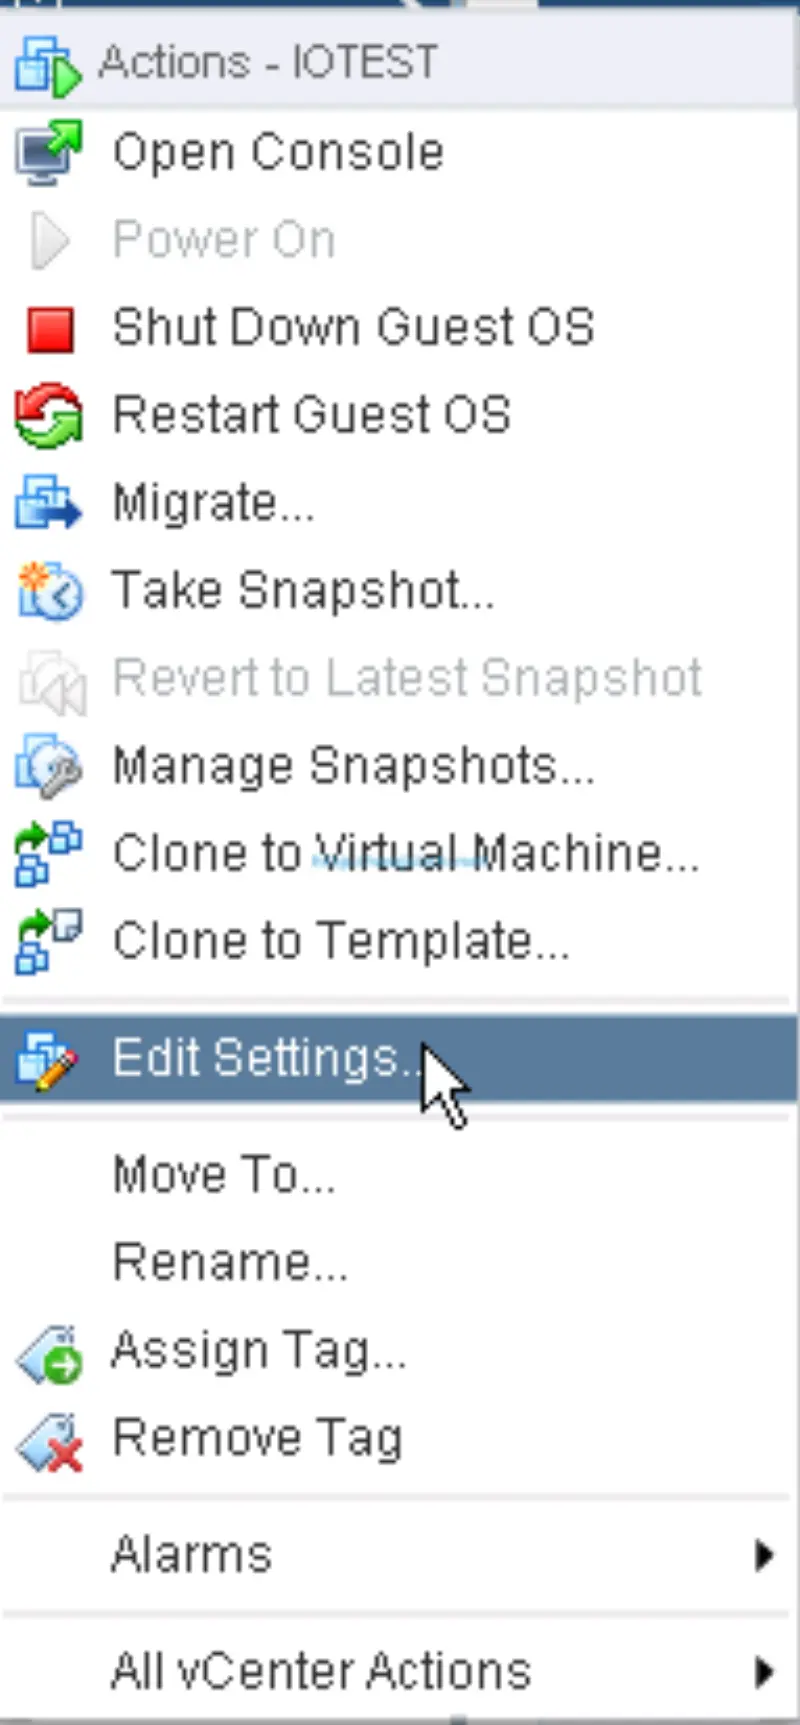
- Select Virtual Machine you want to accelerate and click Edit.
- Select Hard disk you want to accelerate with VMware vFlash Read Cache and expand it.
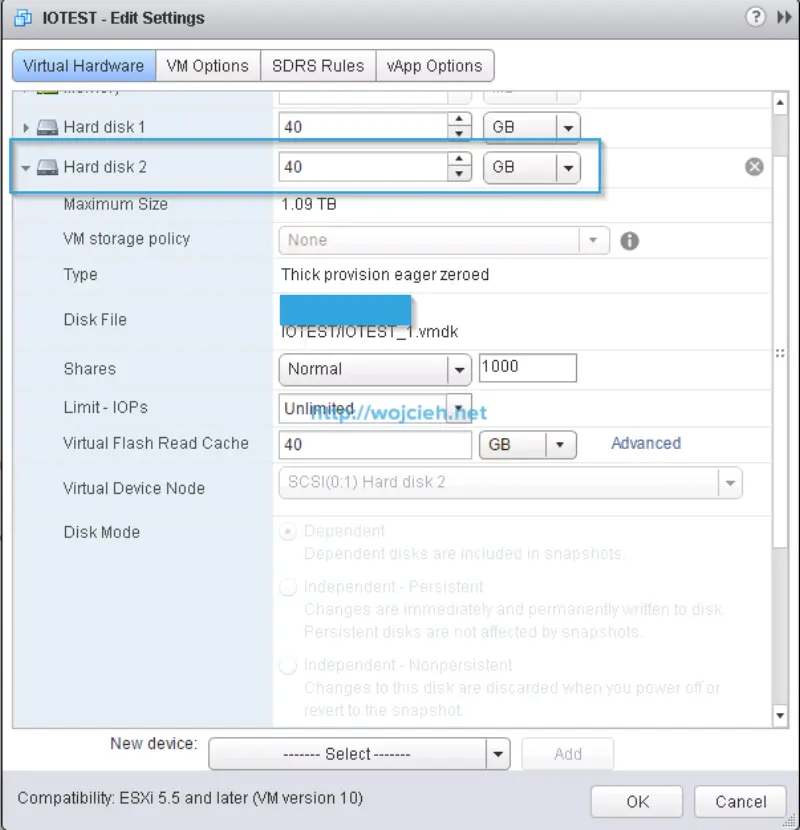
- Click **Advanced **and select:
- Enable virtual Flash Read Cache
- Select desired amount of flash in MB or GB
- Choose block size
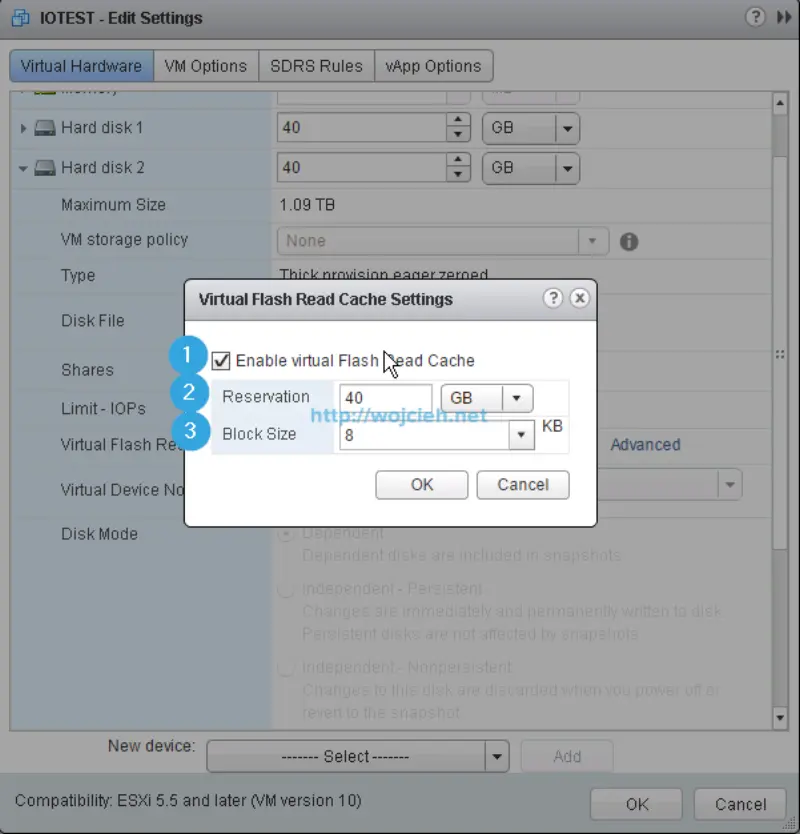
- Click OK and finish with editing of Virtual Machine.
Virtual Machine preparation
Before we will start any tests I installed Virtual Machine with Microsoft Windows Server 2012 R2. Here are details about Virtual Machine:
- Operating System: Windows Server 2012 R2
- vCPU: 1
- vRAM: 4GB
- SCSI Controller: LSI Logic SAS
- Virtual Disk: 40GB Thick Provisioned Eager Zeroed
- Virtual Machine Hardware Version: vmx-10
- Virtual Flash Read Cache size: 40GB
Performance tests
If you want to heave some meaningful data to analyse we need to do some baseline performance tests.
Performance baseline - test with SQLIO
You can download SQLIO performance tool using this link http://www.microsoft.com/en-us/download/details.aspx?id=20163.
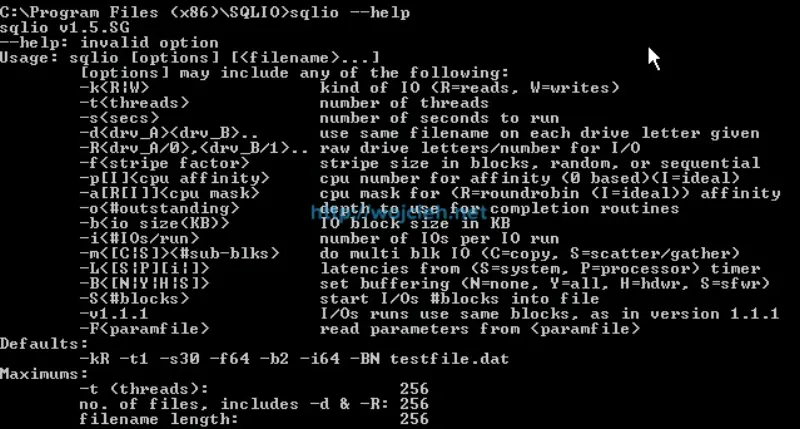
I installed SQLIO in default directory on my Windows Server system. Open command prompt as Administrator in SQLIO folder and execute command **sqlio -help **to see various options you can specify during test.
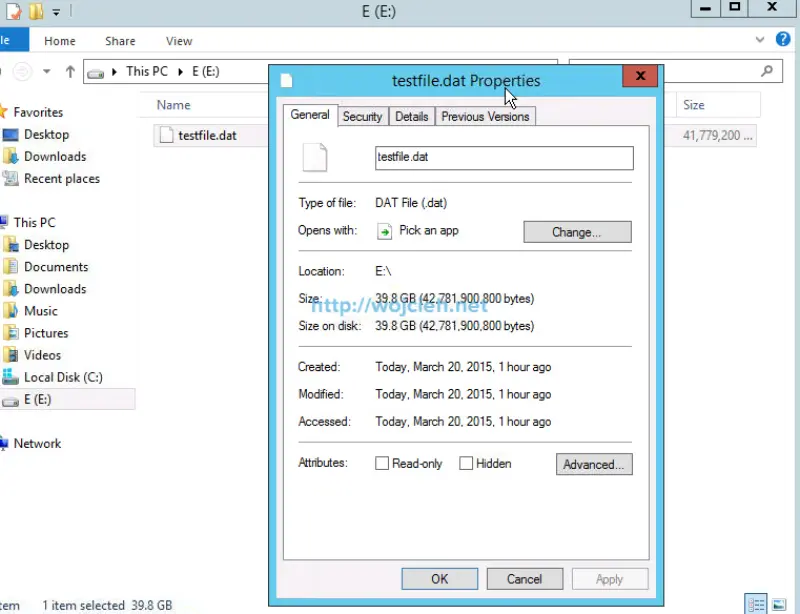
I started with changing file param.txt by setting testfile.dat size from 8MB to 39,8GB.
|
|
Next step is to simply create batch file with various parameters to find sweet spot between IOPS and MB/s.
Sequential read SQLIO test
Here is content of batch file:
|
|
I started batch file by executing command: sequential_read.bat > sequential_read_results_180.txt. After few minutes we got results to analyze.
Sequential read SQLIO test results
To analyze results I used PowerShell script from Jonathan Kehayias which does pretty nice parsing to Excel file with charts.
Results from Excel:
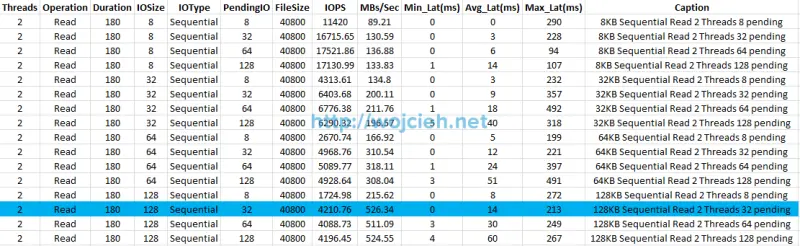
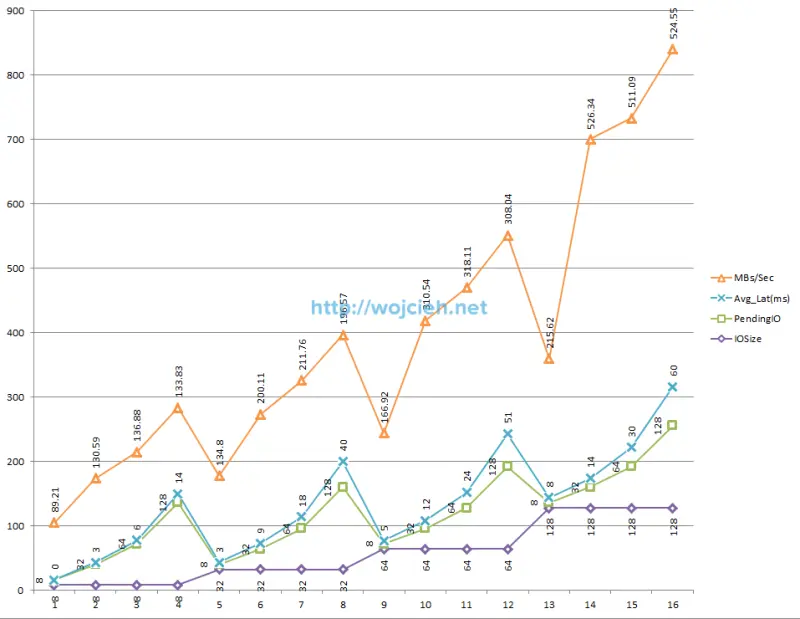
Chart from data.
ESXi performance chart.
As we clearly see best performance is achieved by using IO size 128 KB, with 32 pending IO. We achieved 526.34 MB per second with average latency 14 ms and 210.76 IOPS.
Random read SQLIO test
|
|
Random read SQLIO test results
Results from Excel.
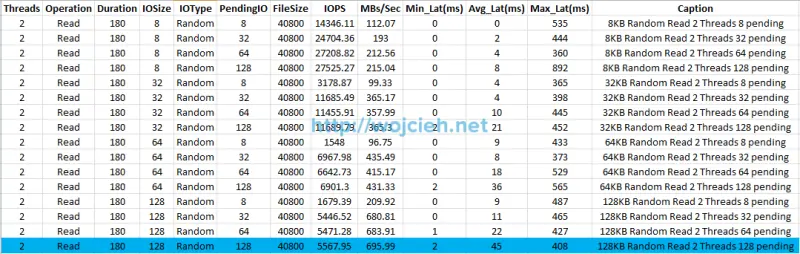
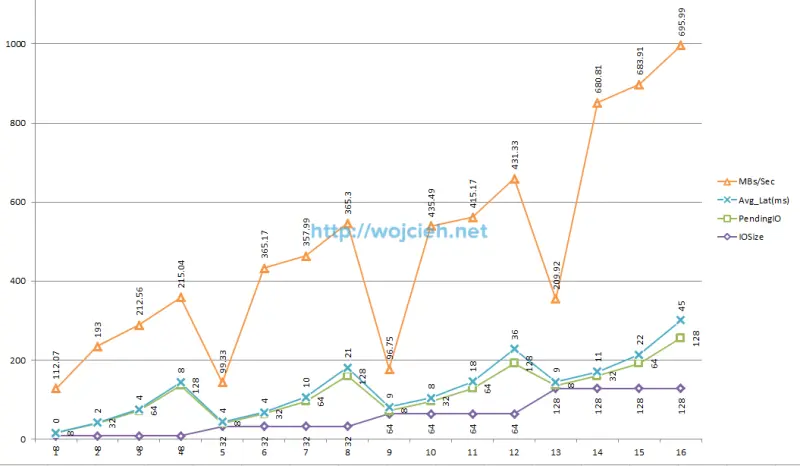
Chart from data.
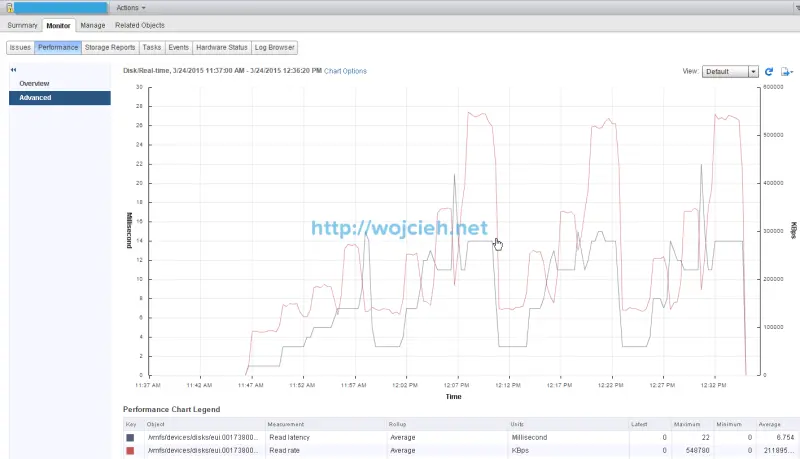
ESXi performance chart.
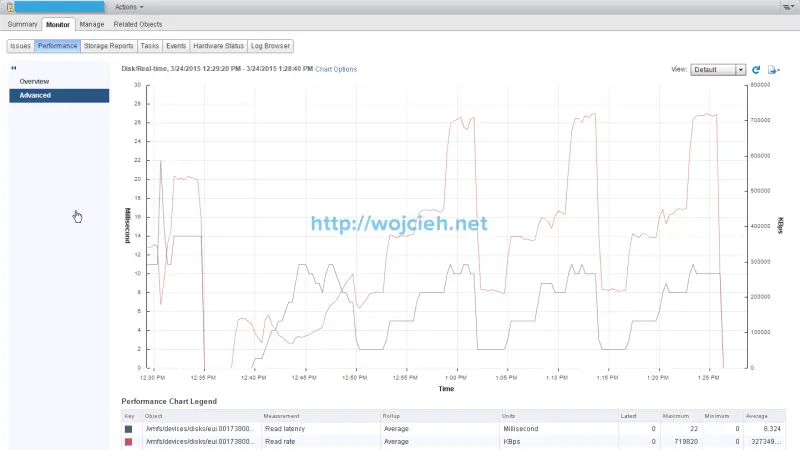
As we clearly see best performance is achieved by using IO size 128 KB, with 128 pending IO. We achieved 695.99 MB per second with average latency 45 ms and 5567.95 IOPS.
Performance test with SQLIO accelerated with vFlash Read Cache
I ran the same tests to check what kind of performance boost I will get.
Sequential read SQLIO test results accelerated
Results from Excel.
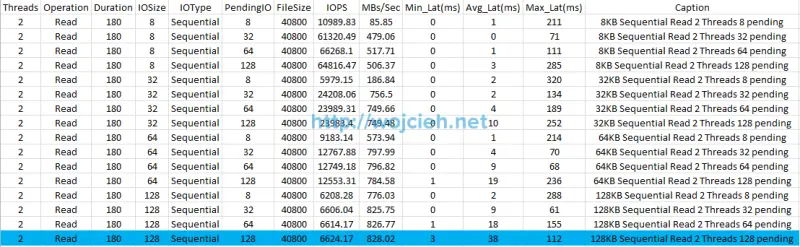
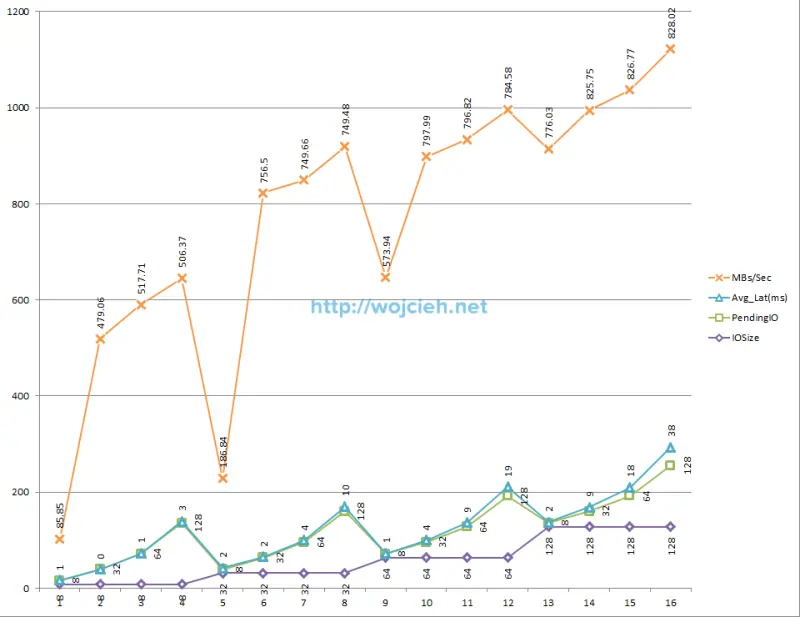
Chart from data.
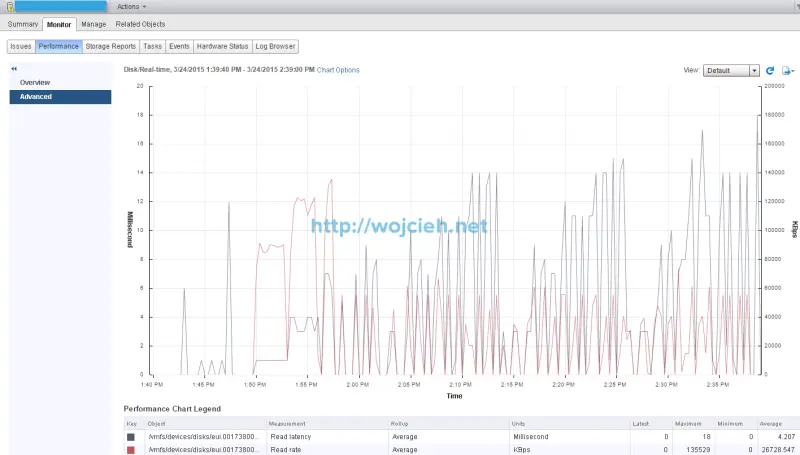
ESXi performance chart shows quite strange results.
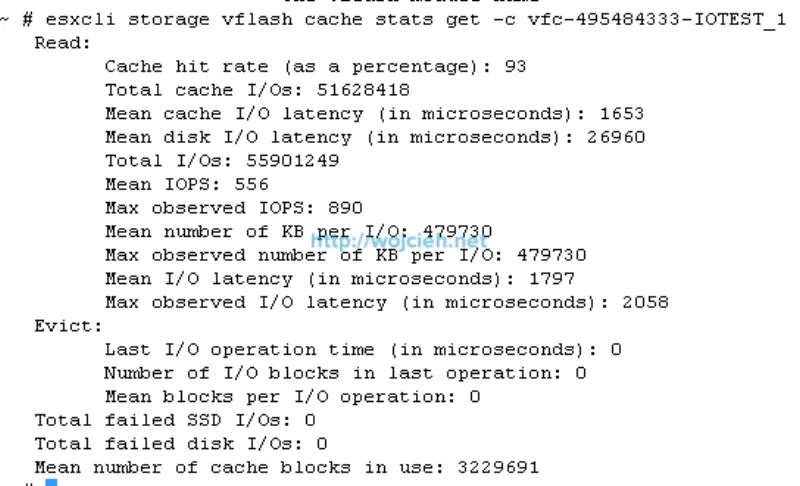
I checked as well vFlash Cache statistics.
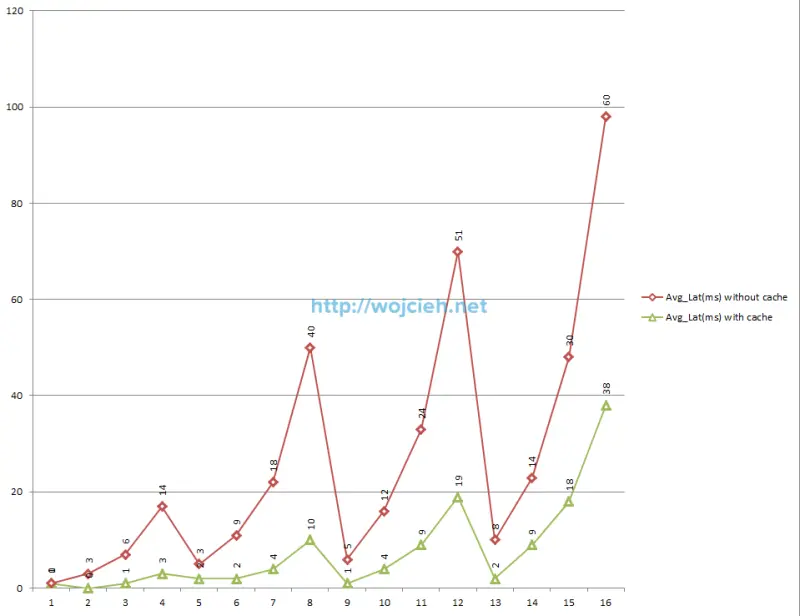
As we clearly see best performance is achieved by using IO size 128 KB, with 128 pending IO. We achieved 828.02 MB per second with average latency 38 ms and 6624.17 IOPS.
Random read SQLIO test results accelerated
Results from Excel.
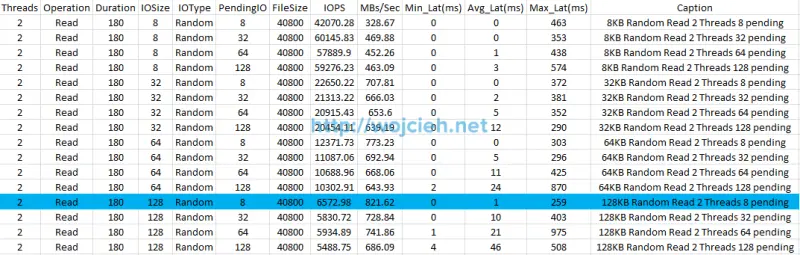
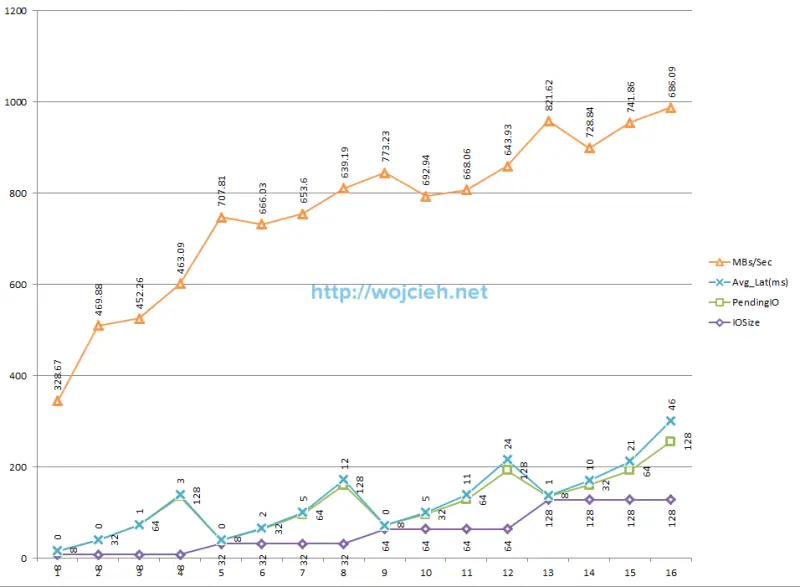
Chart from data.
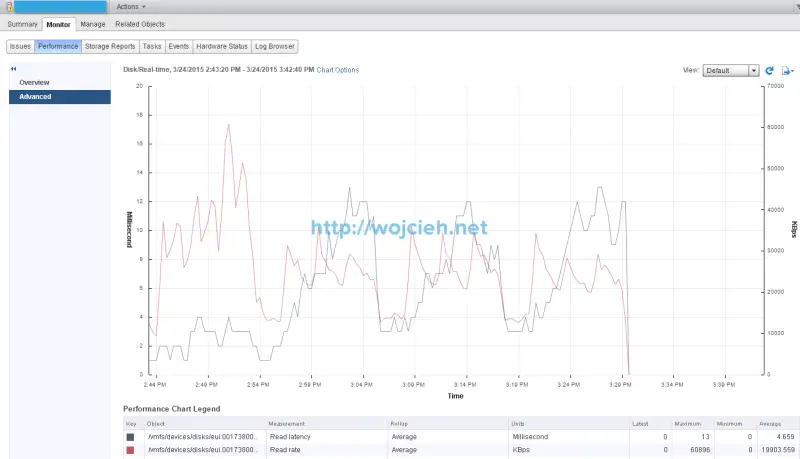
ESXi performance chart shows quite strange results.
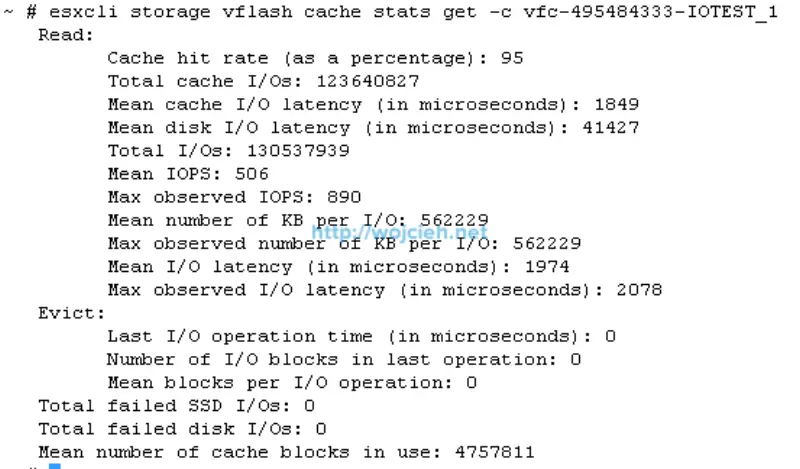
I checked as well vFlash Cache statistics.
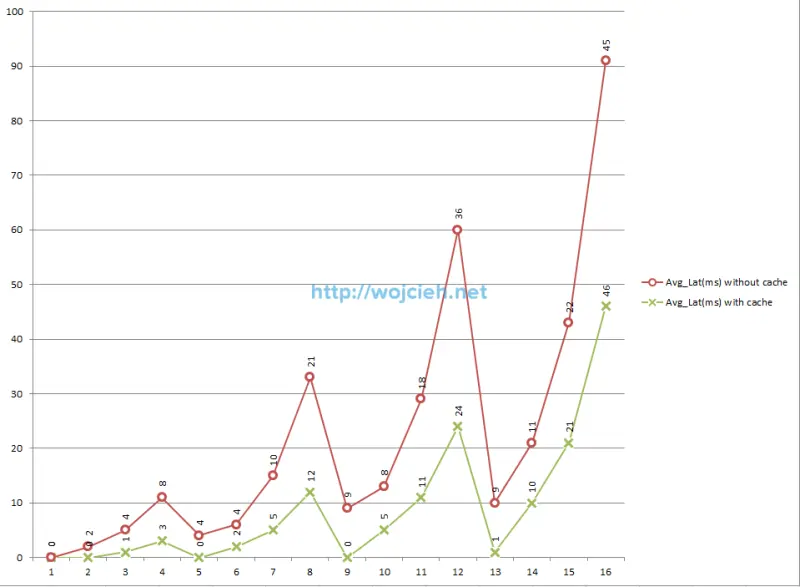
As we clearly see best performance is achieved by using IO size 128 KB, with 8 pending IO. We achieved 821.62 MB per second with average latency 1 ms and 6572.98 IOPS.
Performance results - cached vs no cached
For better view on charts I decided to split results.
Average latency results - sequential read test
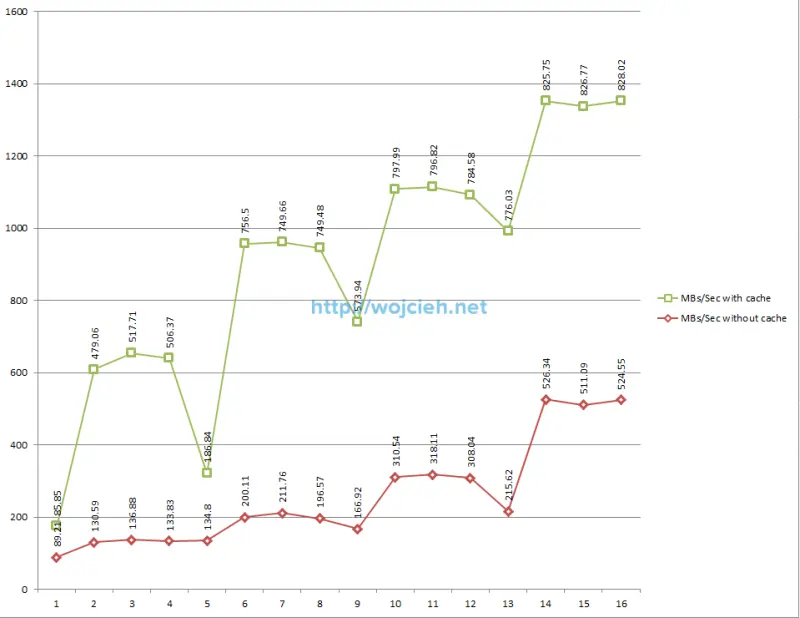
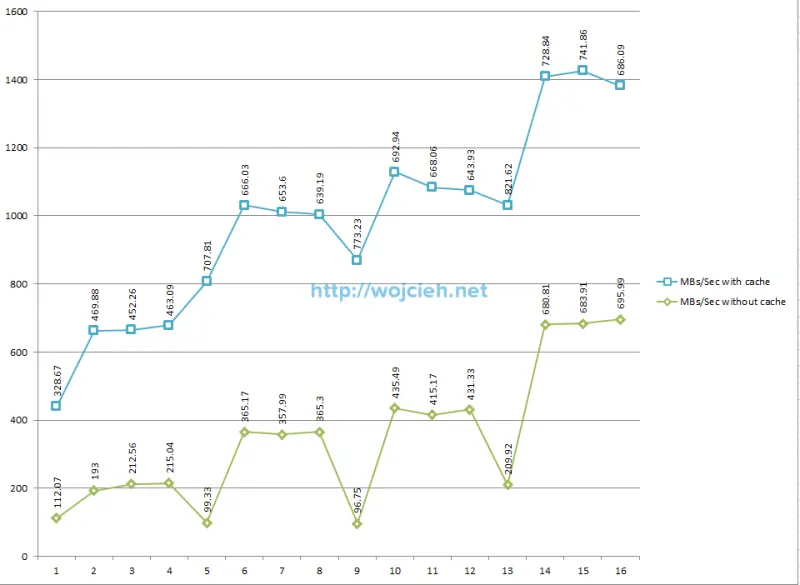
Average megabytes per second results - random read test
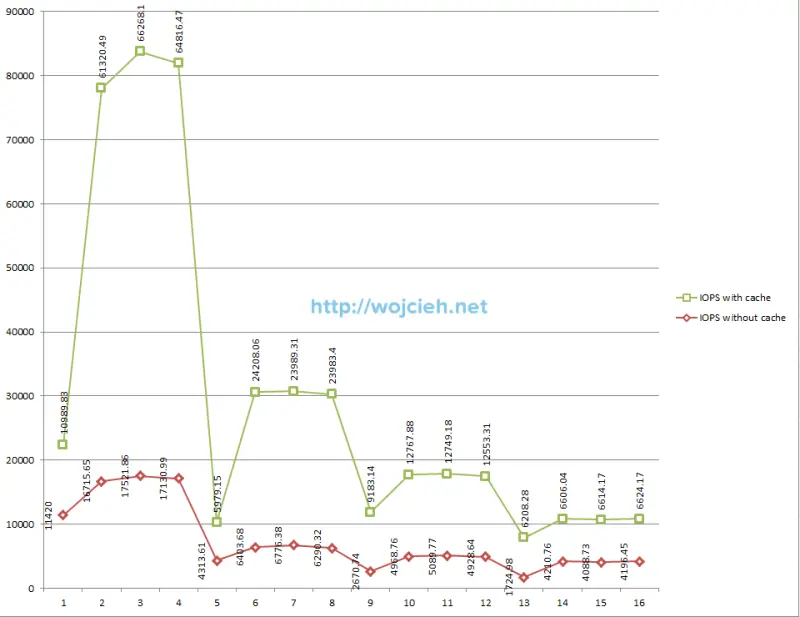
Average IOPS results - sequential read test
Average latency results - random read test
Average megabytes per second results - random read test
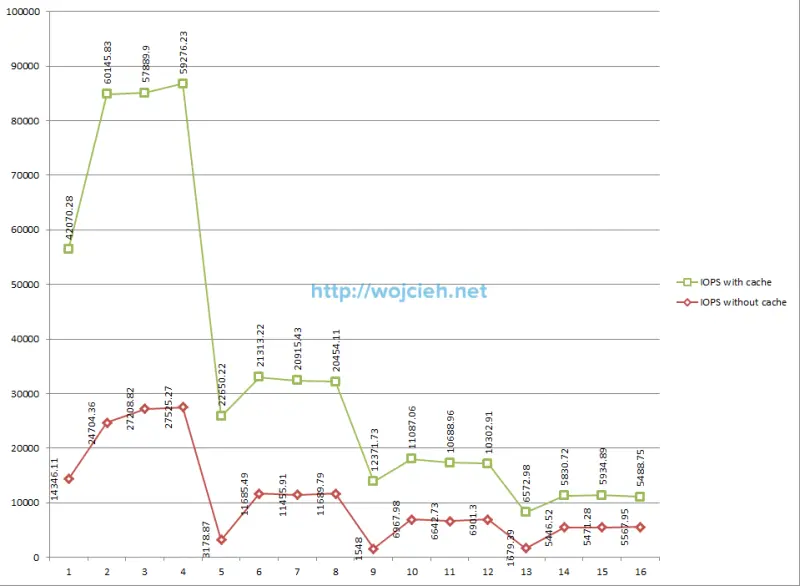
Average IOPS results - random read test
Performance results conclusions
After really long test I can clearly say that I am happy with achieved results. As you see I have quite fast underlying Fibre Channel storage. In my case you see improvement with cached solution pretty much from the beginning of tests in all areas. If your storage is quite slow you will see much better performance increase than me. I hope this post was informative for you and you will test vFlash Read Cache as well with same good results as me.